If you are developing on Arm platform, you have extensive set of methods to establish link between host and target platform, such as:
- Serial port
- USB
- Bluetooth and bluetooth low energy
- ITM
- Semihosting
The last two is the most easiest and convenient one. Because if you connect the debugger to the target system, you already have a device that can communicate, the cable, connector etc for the purpose.. You do not need a USB to TTL device, or complex USB firmware.. Actually with Art library it is not that complex, but that’s another topic.
With semihosting, the target platform, MCU can access to host resources via debug agent:
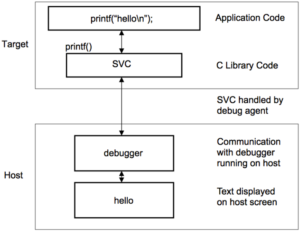 On the internet, there are clones of the same information on the subject. They tell linking against a library that supports semihosting however, there isn’t much about how the semihosting is implemented.
As far as I understand, semihosting is not implemented much on the targed side, but mostly implemented on the debugger software.. I am not %100 sure about this but looking at the how it works, I only see a “trigger” on target side, the rest is cared out automatically.. For instance the following code debugged on LPCXpresso pushed two lines seen in the “Console” tab at the bottom:
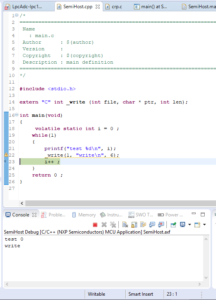 The first line “test 0” written by printf function, the second line with “write” text is written by _write function.. The debugger carries the texts into the console embedded into the eclipse.. _write is mentioned in the semihosting documentation but not defined explicitly. By walking through the source code of newlib, I extracted the implementation. The simplest form of it (dropping the checks etc is the following:
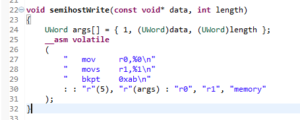 My purpose was to write the semihosting for my Art library that works on multiplatform but this time for STM32F429 series MCU. For those who is not familiar with GCC Assembly, the compiled code is the following:
 What is does is simple.. It loads r0 with r2 which is loaded with 5 before; r1 with r3, which is loaded with address of the argument table before; and executes breakpoint instruction with code 0x00ab. In manual bkpt instruction is defined as following:
The
BKPTinstruction causes the processor to enter Debug state. Debug tools can use this to investigate system state when the instruction at a particular address is reached.
is ignored by the processor. If required, a debugger can use it to store additional information about the breakpoint.imm
From this, I deduce that bkpt stops the CPU, informs the debugger. Debugger reads the code given with bkpt instruction, and takes action. In semihosting page of Arm the format is described as following:
BKPT 0xABFor ARMv6-M and ARMv7-M, Thumb state only.
So, debugger reads the code supplied with bkpt instruction, if it sees 0xAB than it looks at R0. R0 tells the semihosting operation. Those are:
There are more commands, you can follow the Arm’s page.. Here, our semihostWrite function used 0x05, which is SYS_WRITE. R1 points to arrray that holds the arguments used by the command. You can extract the contents of the array in the semihostWrite function. But to name those, there are 3 words (32 bit unsigned integers):
- File number: 1
The file handles are the numbers, and file 1 looks like belonging to debug console.. I think 0x01 SYS_OPEN will open other files stored in the system, and will return numbers other than 1 as handle. - An address to the buffer to read by debugger.
- Length of the buffer to read.
The debugger does the rest. Reads the buffer pointed in the second element in the array, with the length in the third element of the array, copies the contents of the buffer to the terminal..
The opportunity to read/write files stored in the host system is interesting. That way you can dump large amount of data into/from the device without other means of protocol, media etc. Commands 0x11 and 0x12 are also unique. With 0x11 SYS_TIME, you can read the system time and date. With 0x12 SYS_SYSTEM (Arm is really bad at naming) you can execute commands on the system..
Semihosting is very nice but has one bad drawback: It takes a precious time to execute and in that time the CPU is stalled.. I run the following code to test the time it requires to transfer a simple string:
 This write requires whopping 140ms with ST-Link Debugger interfaced with OpenOCD. In the following oscilloscope view of the process, in the blue areas the led is toggled, between those areas the debugger is in control, so the cpu is stalled:
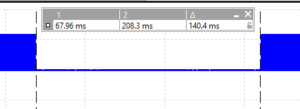 Transfer of a longer string does not effect much the stalling time. I suspected that the handling is time consuming, not the transfer.. May be the debugger is not event driven, but pooling driven.. Who knows?
I do not know if this is because of ST-Link or OpenOCD but knowing that within this period CPU is stalled is not except-able in many applications. I am sure there will be use cases when the time is not critical, for instance when the system is not doing time sensitive operations. At boot time some data can be read from the host system, or at certain times some data can be pushed to the host however, it would not be a regular, non intrusive debugging alternative.. What an opportunity lost..
I’ll implement the semihosting classes anyway. Because most of the handling is done by the debugger it will be very lightweight and there will be gains. However, I’ll use it sparingly..
The sample Art framework code that reads data from host would be like this:
HostStream stream;
stream.open("~/SampleData.dat");
stream.read(data, sizeof(data));
stream.close();
Reading time and date at the host:
Time time = Time::hostTime();
Date date = Date::hostDate();
For instance, you may set the Rtc date and time by the following code:
rtc()->open();
rtc()->setDateTime(DateTime::hostDateTime());
I wish it were faster..
